> ## Documentation Index
> Fetch the complete documentation index at: https://polyai-mintlify-41fdf97b.mintlify.site/llms.txt
> Use this file to discover all available pages before exploring further.
# Conversations
> Inspect individual voice and messaging conversations to debug agent behavior, audit call quality, and review transcripts, function calls, and latency.
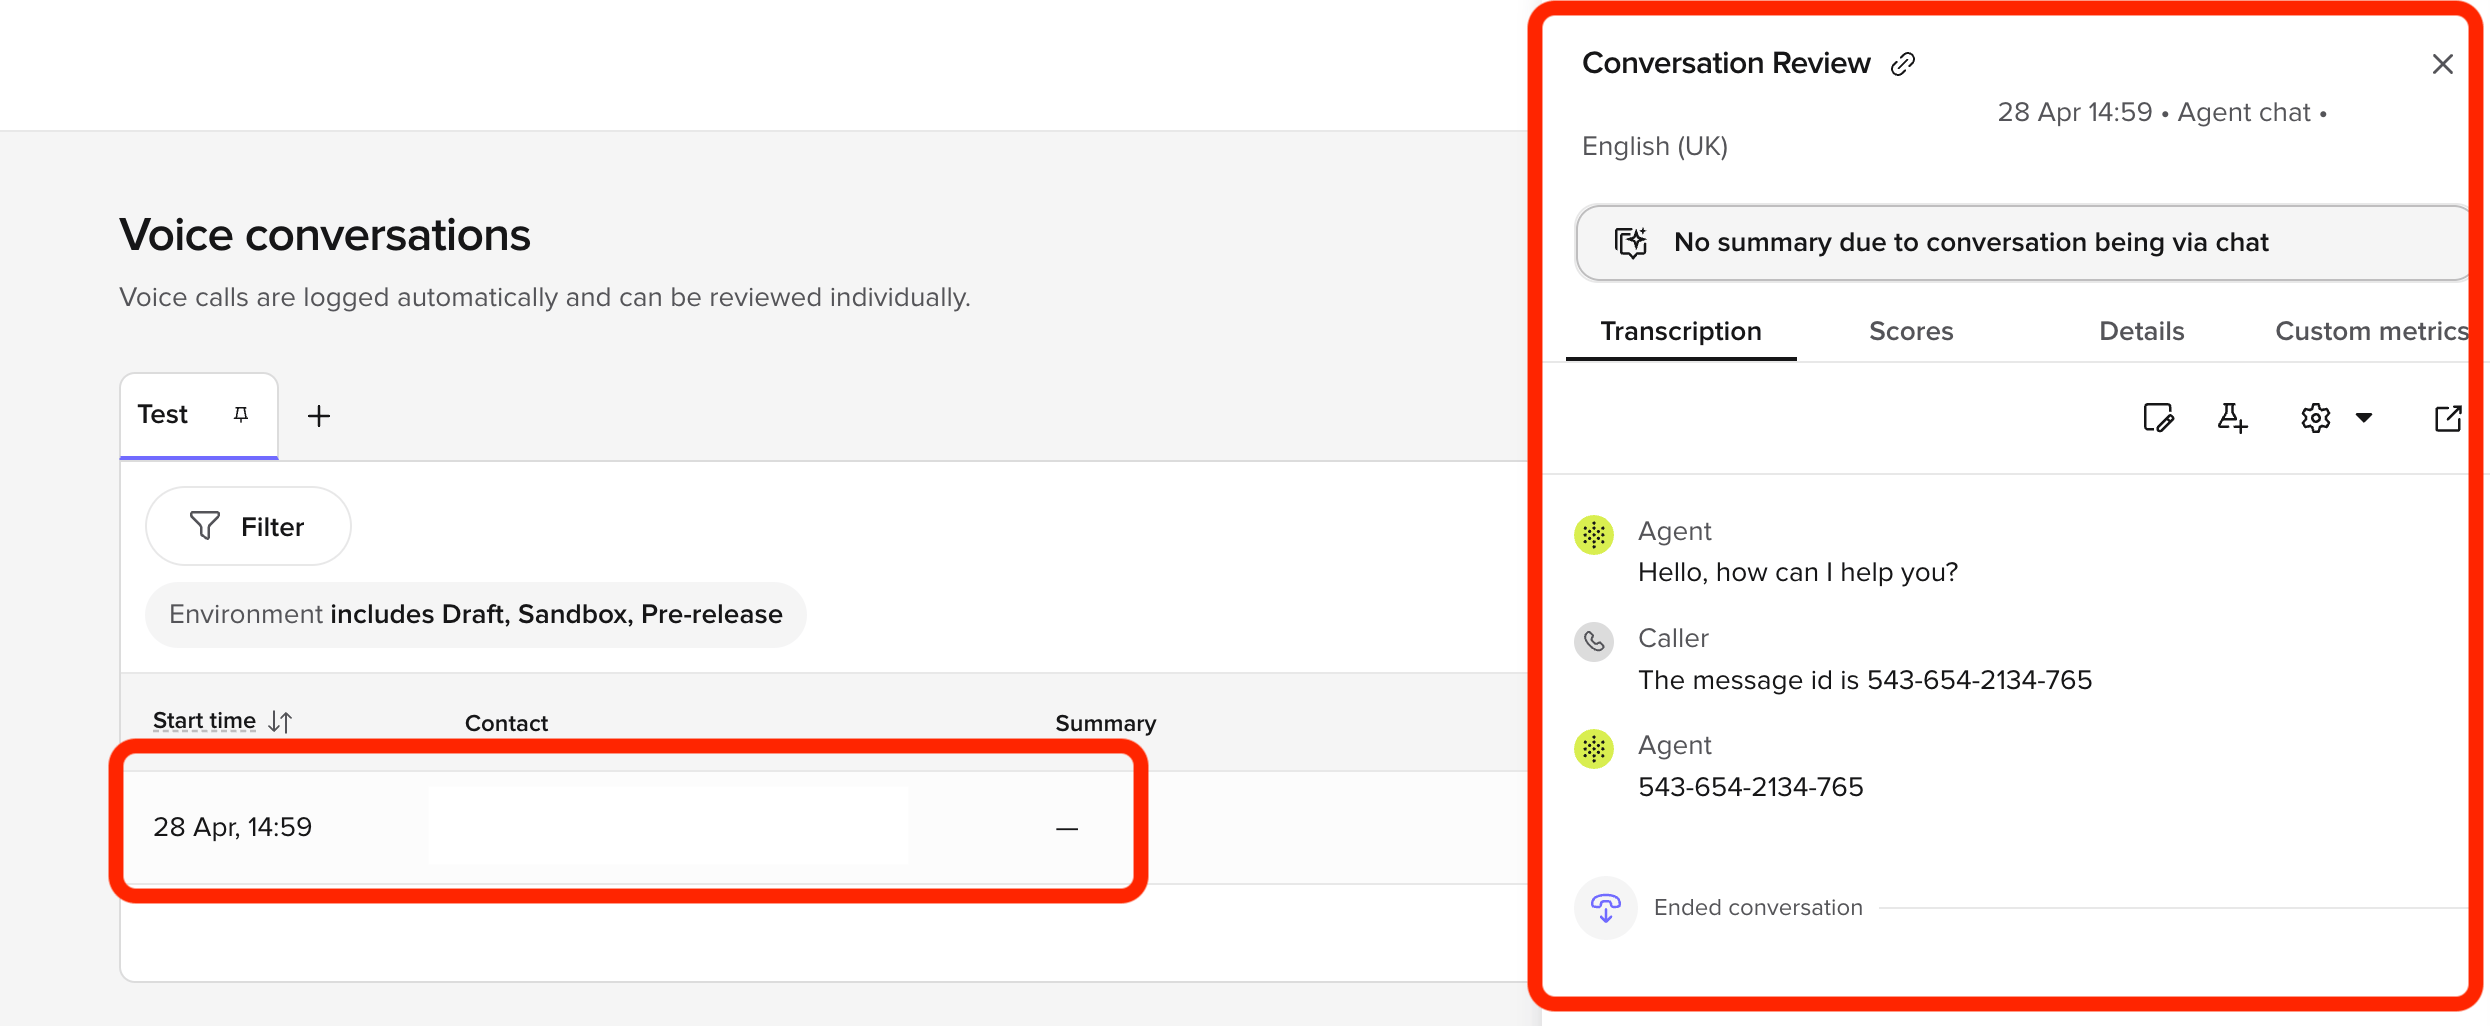 Use **Conversations** to inspect what actually happened on a conversation: transcripts, topic matches, function execution, and latency. When standard or [custom metrics](/analytics/kpis/introduction) show a problem (containment dropping, safety flags rising), use this UI to diagnose the root cause.
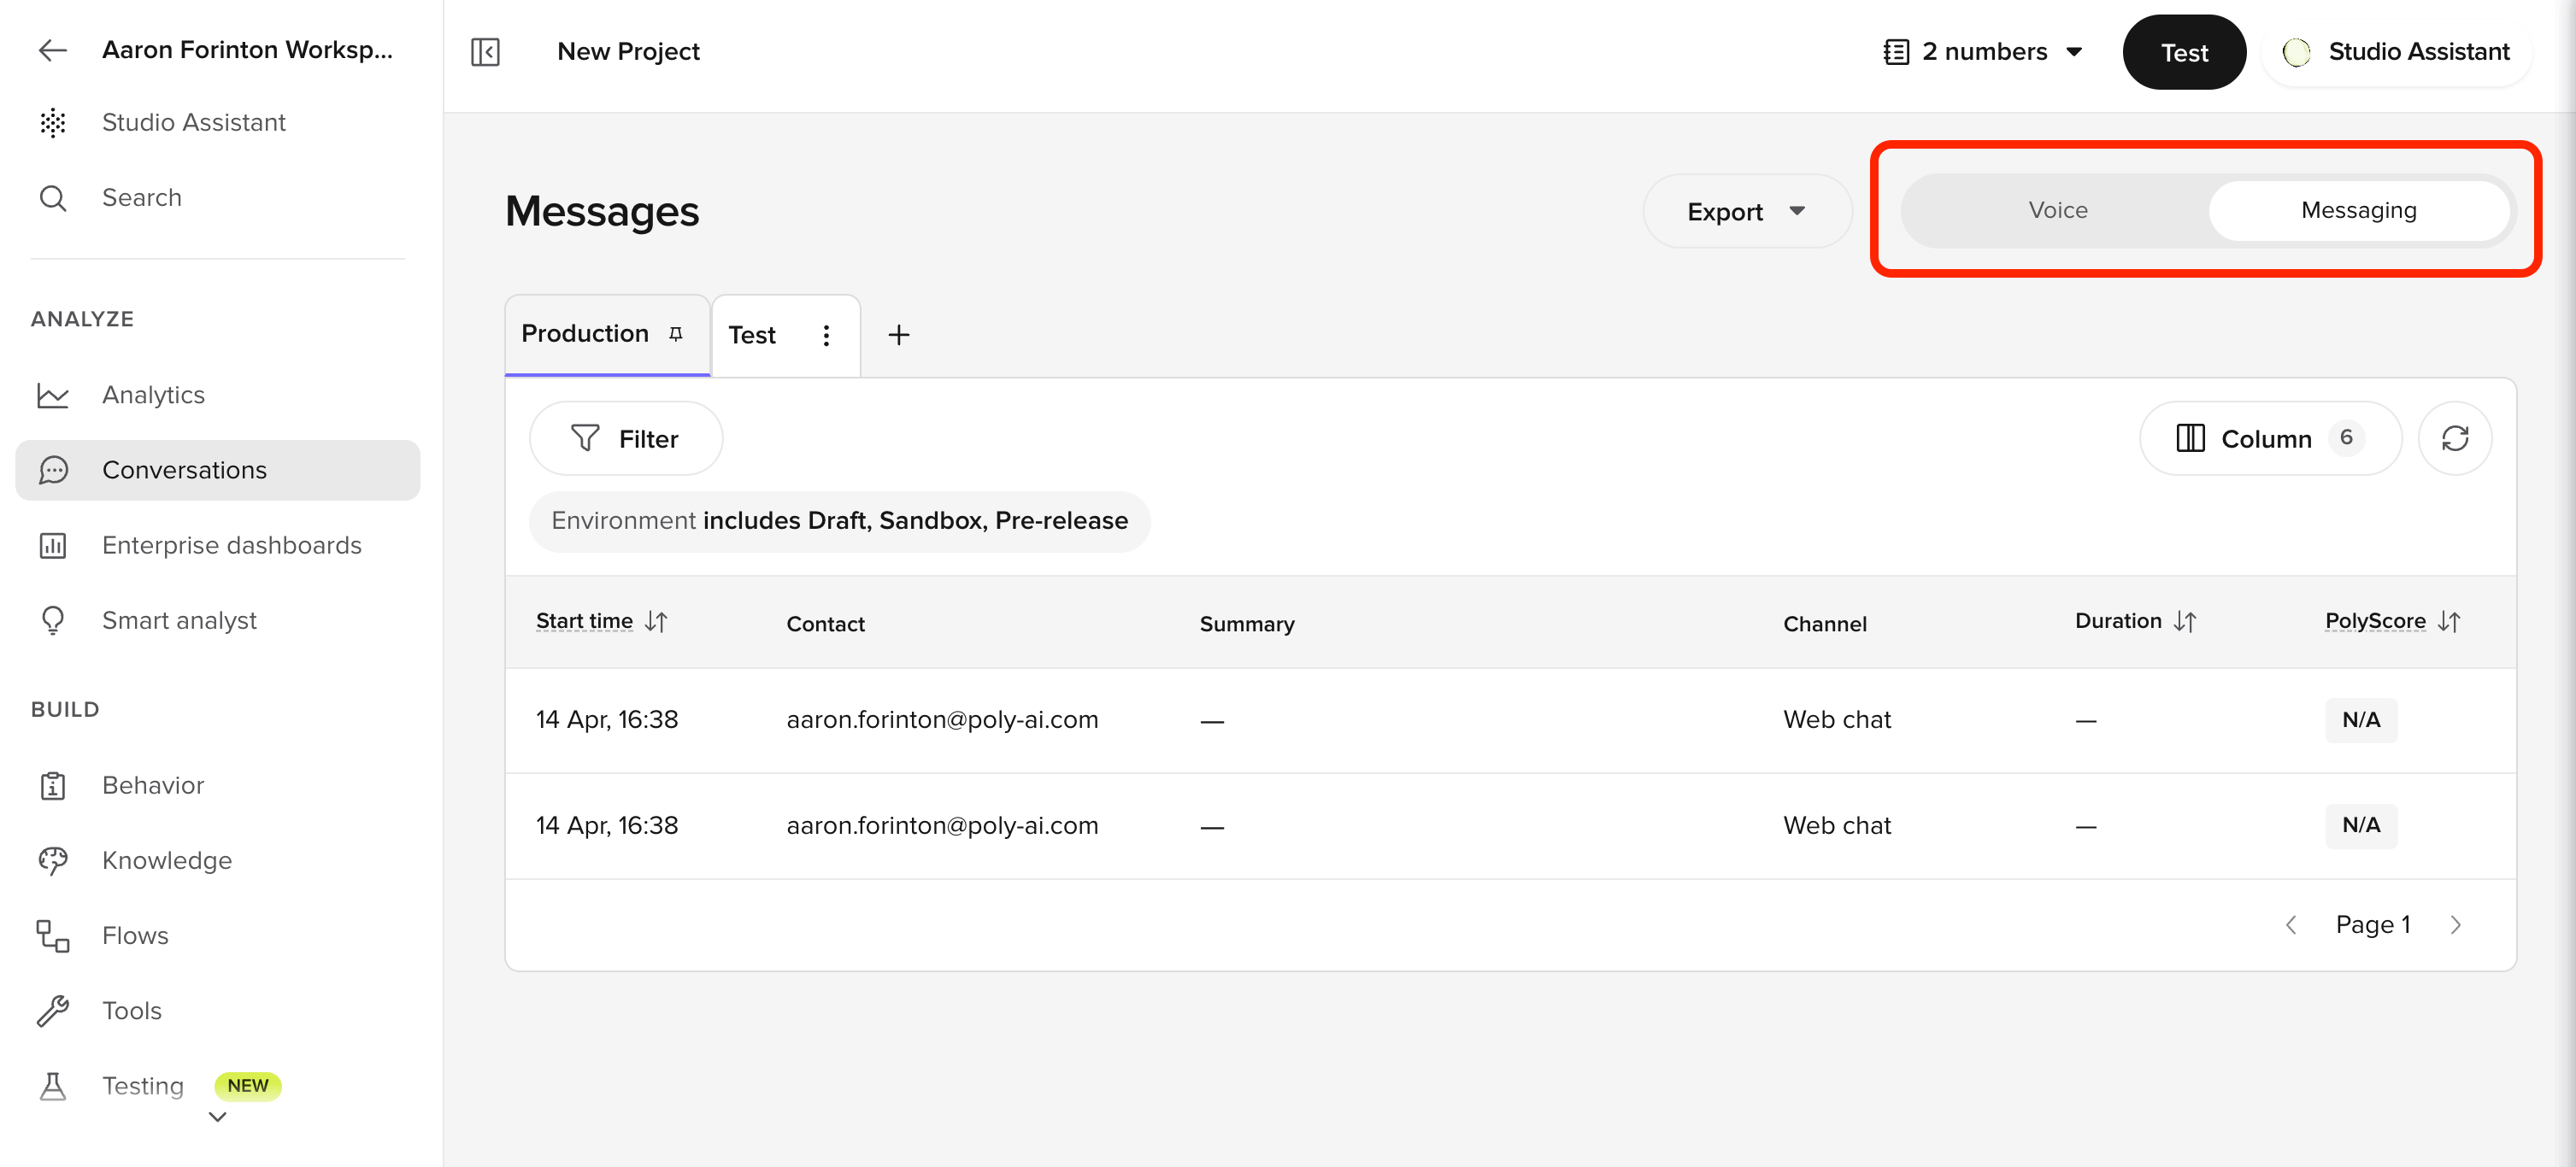
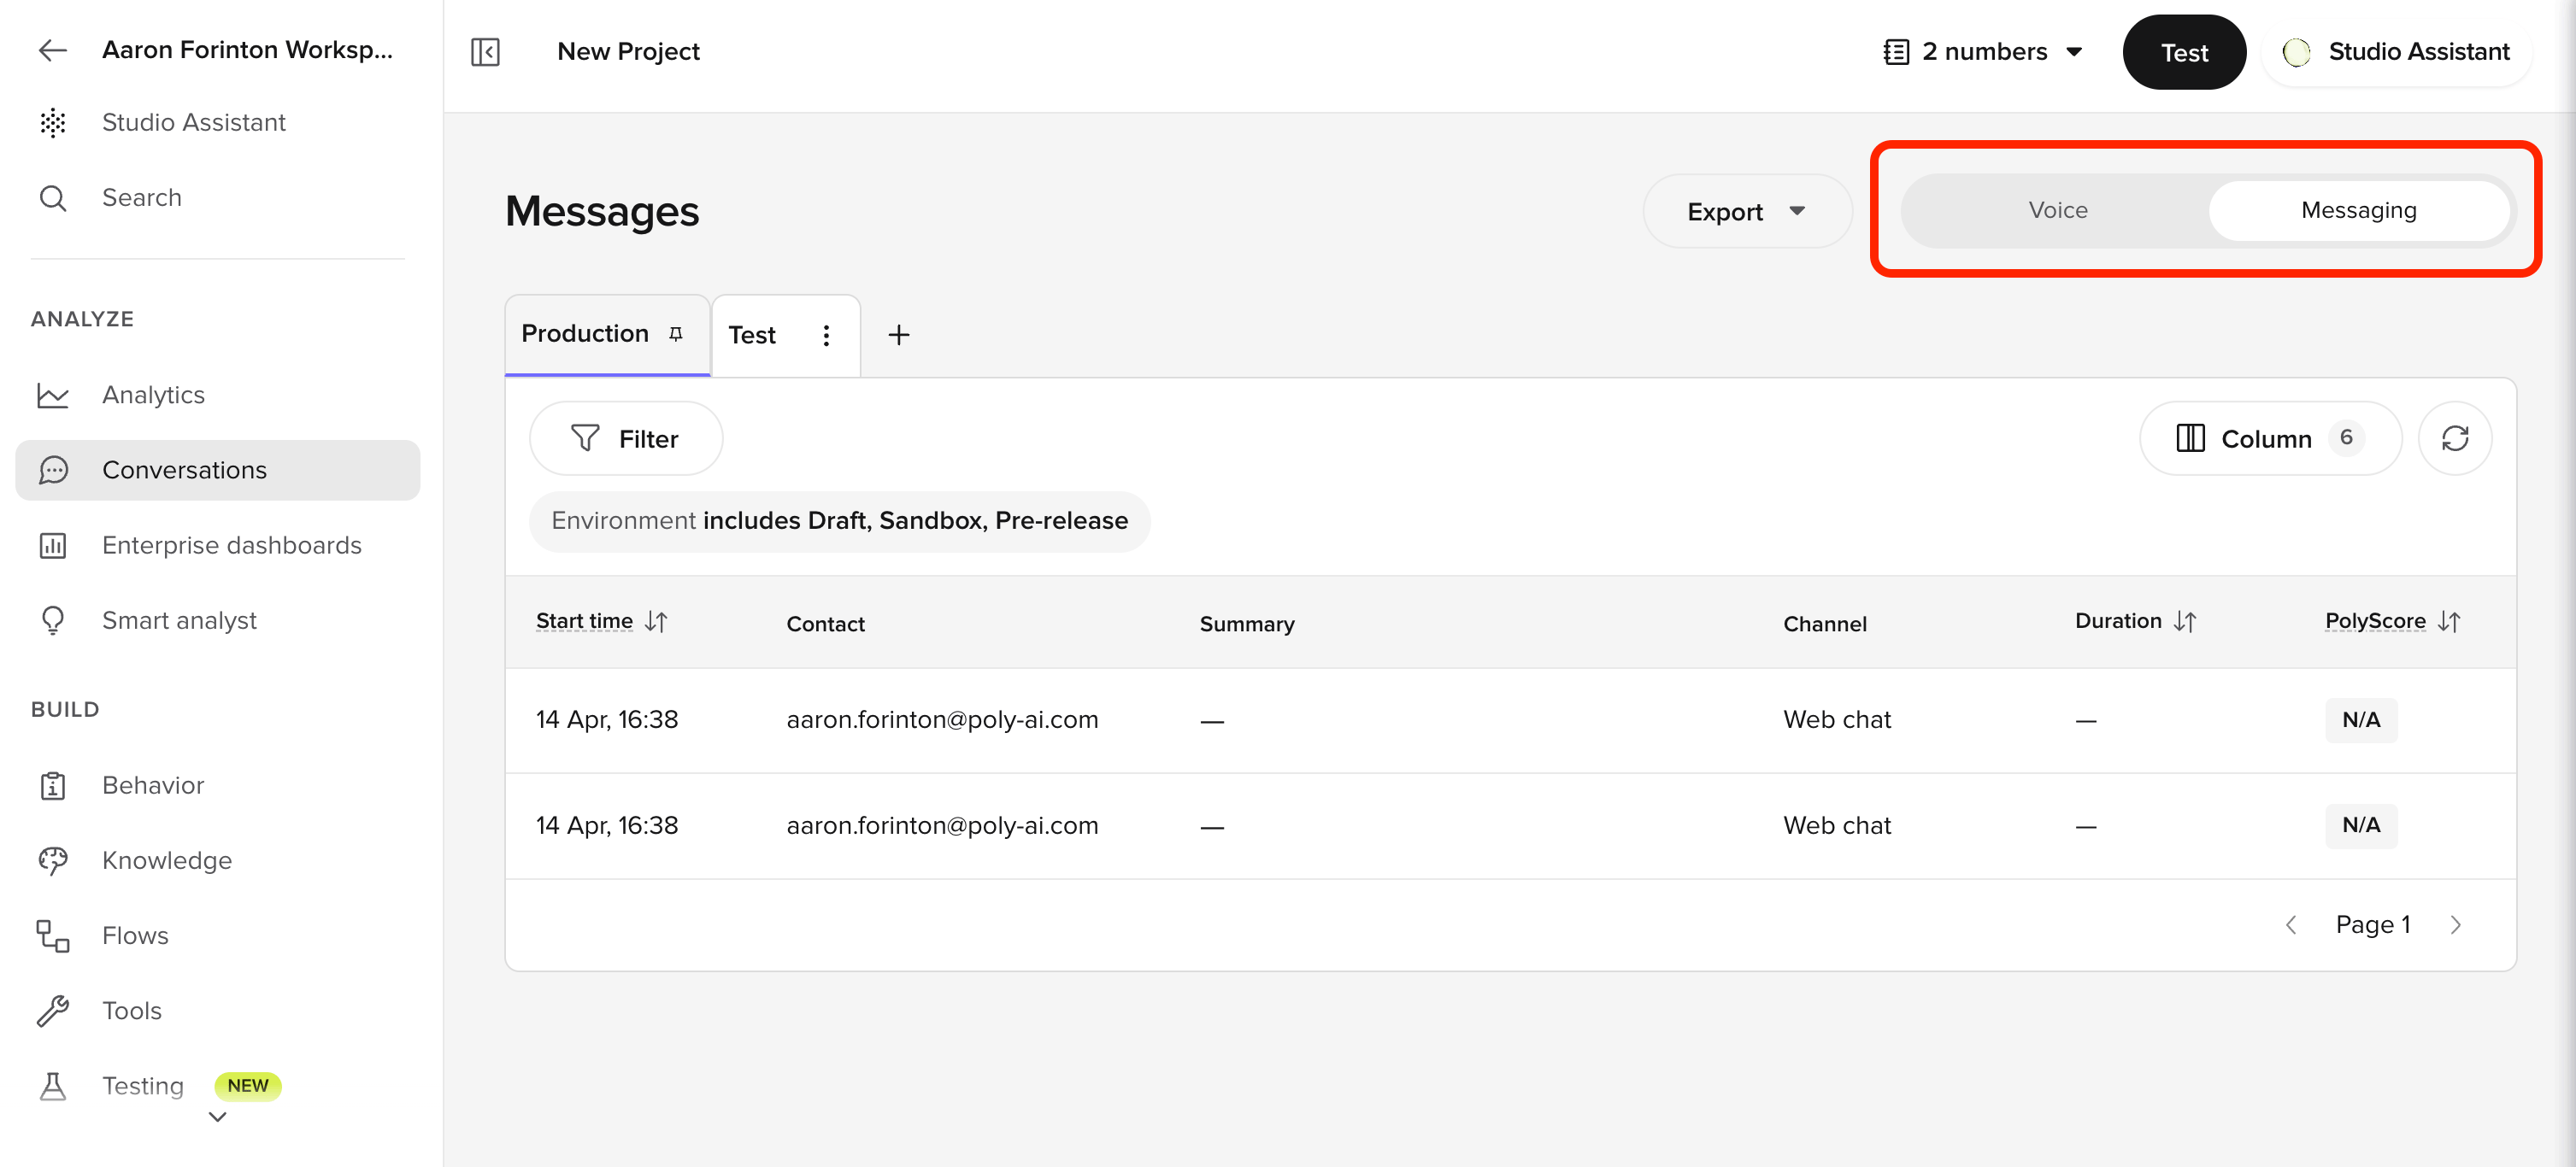
Conversations lives under **Analyze > Conversations**. A segmented **Voice | Messaging** toggle in the top right switches between voice calls and messaging sessions (the messaging subview is titled **Messages**), with channel tabs for Voice and Web chat. Both share the same review, annotation, and diagnosis tools.
Use **Conversations** to inspect what actually happened on a conversation: transcripts, topic matches, function execution, and latency. When standard or [custom metrics](/analytics/kpis/introduction) show a problem (containment dropping, safety flags rising), use this UI to diagnose the root cause.
Conversations lives under **Analyze > Conversations**. A segmented **Voice | Messaging** toggle in the top right switches between voice calls and messaging sessions (the messaging subview is titled **Messages**), with channel tabs for Voice and Web chat. Both share the same review, annotation, and diagnosis tools.
 **Iterate from a conversation with [Wren](/wren/introduction).** After reading a transcript, ask Wren to fix what broke — *"the agent kept asking for the date even after the caller said 'tomorrow'; fix relative-date extraction in the booking flow"*. See [Iterate after a call](/learn/iterate-open-platform).
[Dashboards](/analytics/dashboards/introduction) show aggregate trends; Conversations is where you drill into the individual calls behind those numbers: what topics matched, what functions ran, what the LLM saw on each turn.
For QA workflows, see [QA and analytics](/learn/maintain/qa-analytics). For performance analysis, see [Performance monitoring](/learn/maintain/performance-monitoring).
## Features
Browse, filter, and inspect individual conversation transcripts, both live and completed. Export data for reporting.
Save and share filtered conversation lists as named views for recurring QA workflows.
Flag transcription errors or missing topics during review. Feeds a continuous improvement loop for ASR and your Knowledge area.
Toggle debugging layers to see conversation variables, flow paths, function calls, topic citations, and turn latency.
## Related pages
See aggregate performance trends before drilling into calls
Ask Wren to surface patterns across conversations with natural-language queries
Understand the automated quality score on each conversation
**Iterate from a conversation with [Wren](/wren/introduction).** After reading a transcript, ask Wren to fix what broke — *"the agent kept asking for the date even after the caller said 'tomorrow'; fix relative-date extraction in the booking flow"*. See [Iterate after a call](/learn/iterate-open-platform).
[Dashboards](/analytics/dashboards/introduction) show aggregate trends; Conversations is where you drill into the individual calls behind those numbers: what topics matched, what functions ran, what the LLM saw on each turn.
For QA workflows, see [QA and analytics](/learn/maintain/qa-analytics). For performance analysis, see [Performance monitoring](/learn/maintain/performance-monitoring).
## Features
Browse, filter, and inspect individual conversation transcripts, both live and completed. Export data for reporting.
Save and share filtered conversation lists as named views for recurring QA workflows.
Flag transcription errors or missing topics during review. Feeds a continuous improvement loop for ASR and your Knowledge area.
Toggle debugging layers to see conversation variables, flow paths, function calls, topic citations, and turn latency.
## Related pages
See aggregate performance trends before drilling into calls
Ask Wren to surface patterns across conversations with natural-language queries
Understand the automated quality score on each conversation